Of all types of vehicles, it is motor transport that is considered the most dangerous. This is what accident statistics, which is based on the number of human victims. Automobile transport is the most widespread means of transportation, so more and more citizens of Russia and other countries purchase a personal car, less often a motorcycle or scooter.
What you need to know about an accident
Road accident, road accident - a situation that has arisen during the movement of transport or with its direct participation, during which there are injured or dead, damage to the transport itself, cargo, road structures (Wikipedia). 2000 to 2016 In Russian federation there were 3 391 591 road traffic accidents, where 499 791 people died, 4 182 183 people were injured.
In 1896, on May 30, the first car accident occurred in New York: a collision of a bicycle with an electric car, as a result of which a cyclist suffered a broken leg. Damage factors in road accidents:
- injuries caused by debris of the transport itself or its parts (for example, windshield);
- a blow in a collision with a car moving at speed or sharply braking (on motorcycles - the most dangerous);
- prolonged pressure when the car is clamped by the crumpled wreckage;
- exposure to carbon monoxide and high temperatures during a vehicle fire;
- poisoning as a result, transported by special vehicles.
Classification: collision with: stationary vehicle, pedestrian, cyclist, animal or obstacle:
- collision on highways;
- rollover;
- private men and women in Russia.
Factors provoking accidents in road transport:
- overspeeding (road accidents due to non-observance of the distance are the result of traffic violations);
- ignoring seat belts, child restraints;
- driving faulty vehicles;
- /, including when riding motor vehicles;
- driver fatigue, lack of sleep;
- unfavorable weather conditions;
- inadequate road quality;
- the presence of reasons that distract the driver on different types of transport: using a mobile or other electronic device while driving (navigator, media player), communicating with a passenger, eating while driving, listening to music.
Traffic Accident Data 2015-2016
To compare the Russian road situation with the world, one should consider the data on road accidents in a number of countries of the near and far abroad.
Russian data
General statistics of accidents in Russia in 2015:
Russian accident statistics for 2016 Further:
Russian accident statistics for women and men in 2015:
Russian women accident statistics and men who are more likely to become a participant in car accidents (traffic police statistics for 2016):
Accident statistics (Moscow) on years:
| Year | Quantity | The dead | Wounded |
| 2015 | 10 396 | 673 | 11 903 |
| 2016 | 9 045 | 561 | 10 326 |
| January-March 2017 | 1 132 | 68 | 1 291 |
| Brand | Collisions | The death toll |
| Kia rio | 96 | 149 |
| Nissan tiida | 44 | 130 |
| Hyundai solaris | 65 | 120 |
| Chevrolet aveo | 65 | 99 |
| Hyundai accent | 43 | 86 |
World data
In the world traffic accident statistics for 2015 shows that up to 1.25 million people die in road accidents every year:
- 23% of the victims are motorcyclists;
- 49% of those killed were not driving a vehicle;
- death in an accident by statistics of accidents in the world, the main reason for the death of young people 15-29 years old;
- by country - 90% of world car accidents occur in states with an average and.
USA
Indicative statistics of accidents in the USA for 2015:
- 35 thousand fatal cases;
- one third of it is the fault of a drunk driver, every tenth is due to an inattentive car owner (women and men driving);
- there are 809 cars for every thousand citizens (2014), compared to Russia, where there are 317 cars per thousand inhabitants.
The situation in the EU
European statistics of traffic accidents for 2016:
- on average, 70 people die in road accidents per day, 350 are injured per day (490 and 2450 per week, respectively);
- in 2016, 25,500 people died in road accidents and 135,000 were injured (video from recorders shows that most of them are cyclists, motorists and pedestrians);
- according to statistics accidents in England in 2016 killed about 30 people per 1 million citizens, in Romania and Bulgaria - 100 per 1 million, in Estonia - 54 people.
Ukraine
2016 – statistics of accidents in Ukraine(in Ukraine):
- total road traffic accidents - 158,776;
- incidents where the dead were - 4 003;
- injured - 33 613.
Belarus
Based on the official statistics of 2015 in the state of Belarus:
- the number of incidents - 4,119;
- the death toll - 618;
- the number of victims - 4 389.
Accidents involving various types of vehicles
All traffic accident statistics differs depending on the type of vehicle that was a participant in it.
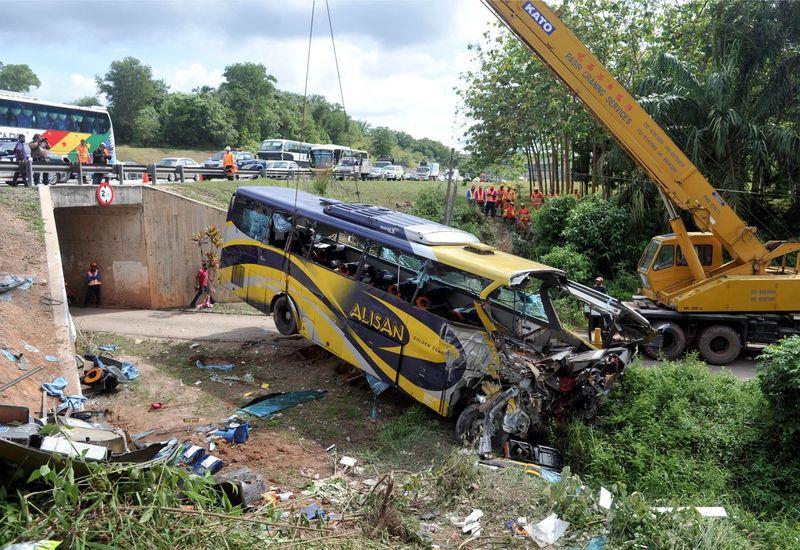
Accidents involving buses
Russian traffic accident statistics with the participation of minibuses carrying out passenger transportation:
Summary bus accident statistics in Russia:
Accidents involving cars
Russian car crash statistics, trucks and cars, on gasoline and:
| Year | Light transport | Freight transport | |
| Number of accidents | 124 942 | 11 091 | |
| The dead | 15 316 | 1 768 | |
| Traumatized | 168 828 | 14 048 | |
| Number of accidents | 115 428 | 11 091 | |
| The dead | 13 100 | 1 737 | |
| Traumatized | 157 846 | 14 174 |
The main causes of accidents according to statistics road accidents in Russia in the table (2016):
| Poor road surface quality | About 14 thousand incidents |
| who accidentally ran out onto the roadway in the wrong place | 8 507 cases |
| Increase in road traffic on weekends | Sat - 12 235; Sun - 12 464 emergencies |
| Violation of traffic rules (solely through the fault of the driver, as specifies car accident statistics) | 68 412 incidents |
| Collision of two or more vehicles | 32,754 cases |
| Hitting a pedestrian | 23 724 collisions |
| Rollover for any reason of the car | 7 096 road accidents |
Accidents involving motor vehicles
Russian statistics of motorcycle accidents, mopeds, scooters:
The peak of emergency situations occurs in the midst of the motorcycle season - May-September. National team statistics of fatalities in accidents claims that the most dangerous month for motorists is July. Patriotic traffic accident statistics shows that 62% of all road accidents involving motor vehicles are collisions with vehicles or other obstacles. The remaining 38% of cases are caused by collisions with pedestrians, motorcycle falls, etc. In an accident involving motorcyclists, the culprit is:
- a passenger car (62.04%);
- motor vehicles (by type - motorcycle - 25.99%, scooter - 2.94%, other motor vehicles - 3.51) - 32, 44%;
- freight transport - 3.09%
- other persons involved - 2.43%.
The most unsafe time for a motorcycle and car trip is from 17.00 to 22.00, the quietest is from 3.00 to 7.00. Ironically, most motorcycle accidents have happened on weekdays over the past five years. At motorcycle accidents - statistics taking into account the availability of a set of equipment (2015):
The statistics of accident victims and other factors lead to a number of conclusions:
- The overwhelming number of accidents occurs due to a collision with a passenger car, as shown by car crash statistics cars and trucks.
- About 3% of road accidents are caused by motorcycle breakdowns.
- The road surface was the fault of 2% of the accidents.
- In an accident with several participants, the reason for most of them is that the driver of another type of transport did not give up the lane to the motorcyclist. The latter either did not notice the motor owner at all or saw him too late.
- Accidents are frequent when the owner of the car, intentionally not letting the motorcycle pass, makes a left turn maneuver in front of him.
- Motorcycles are involved in accidents on short trips, in most accidents at the beginning of the journey.
- In 62% of cases, after the tragedy, fuel was spilled, which means that there was a very high probability of instant fire at the scene of the accident.
- At the time of the accident, the speed of most motorcyclists did not exceed 35-50 km / h.
- The most frequent victims in the traffic police reports are young people 16-24 years old, of whom 4% are girls (statistics of accidents of men and women in Russia on motor vehicles).
- Who gets into motorcycle accidents more - pupils, students,.
- There are frequent cases of recurrence of an accident with the same motorcycle driver.
- 92% of the victims did not undergo special training in driving a motorcycle - they mastered the skill of driving a motorcycle with the help of friends or on their own.
- TO then more often gets into an accident - according to statistics more than half of the injured motorcyclists had a driving experience of no more than five months. The general average driving experience of road traffic accident participants is three years.
- As the saying goes fatal accident statistics, in half of the road traffic accidents that ended in the death of the motorcyclist, traces of alcohol were found in the blood of the deceased.
- To prevent accidents on the roads of Russia, the owner of the motorcycle is given a case of only two seconds.
- The presence of a passenger does not in any way increase the likelihood of getting into an accident.
- Only 40% of bikers involved in road accidents were equipped with a safety helmet.
- Ten percent of those involved in an accident and health.
- Cafe racers, choppers, bobbers (of various colors and brands) are the rarest persons involved in road accidents.
- When colliding with other vehicles, 98% of motor owners are injured, in single accidents - 96%, of which 45% are severe injuries.
Safe transport rating
In 2015, a study was conducted to determine the safest mode of transport. Its results were as follows:
- - the safest. If we take into account the American and European railroad transportation, then there are 0.2 human casualties per 1.5 thousand kilometers of the road. In the Russian Federation, this figure is slightly higher - 0.7 deaths for the same section of the route.
- (including small aircraft and helicopters in the calculations). 0.5 deaths per 1.5 thousand km of flight. At the same time, small planes are considered safer than roomy liners. The fear of using this type of transport is due to the fact that in the event of an air accident there is almost no chance of staying alive.
- Bus. 0.5 human victims per 1,000 km of the road. Europe (statistics of accidents "buses")- a place where bus transportation is considered the safest in existence.
- Automobile. 4 deaths per 1.5 thousand km of the road.
- The universal accident statistics (buses) - worldwide in fifth place is the transport of the "Gazelle" type.
- Space vehicles. Out of 530 space ships, 18 crashed. Accidents occurred during launch or during landing.
- 20 deaths per 1.5 thousand km of the route. This includes both accidents and accidents.
- ... The most dangerous urban transport. If we take the statistics of road accidents in the Russian Federation as an example, then the Moscow metro is considered the most dangerous.
- A bike. The simplest and most environmentally friendly transport takes the penultimate line of the rating - 35 deaths of cyclists per 1.5 thousand kilometers. The main percentage of accidents is collisions with vehicles.
- Motorcycle, scooter, moped. The most dangerous type of movement is 125 deaths (20% of all road traffic accidents) per 1.5 thousand kilometers, which is 28 times more than the number of victims traveling by car. A bus accidents in Russia according to statistics show less scary numbers. At the same time, motor vehicles make up 1% of the total world transport.
The accident statistics presented here are another reason to think about road safety. Behind these dry numbers there are quite real lives of people, someone's grief, incorrigible mistakes.