The analytical agency We Are Social and the largest SMM platform Hootsuite have jointly prepared a package of reports on the global digital market Global Digital 2018. According to the data presented in the reports, today more than 4 billion people use the Internet worldwide.
More than half of the world's population is now online, and about a quarter of a billion of them went online for the first time in 2017. The fastest growing is in Africa - the number of Internet users on the continent has increased by more than 20% compared to the same period last year.
Affordable smartphones and low-cost mobile Internet tariffs have become one of the key drivers of Internet audience growth this year. In 2017, more than 200 million people became owners for the first time mobile devices, and now two-thirds of the 7.6 billion of the world's population have mobile phone.
More than half of the mobile devices in use today are classified as "smart", so it is becoming easier for people to access all the possibilities that the Internet has to offer, wherever they are.
The growth is also noted in the audience of social networks. In the last 12 months, the number of people on the most popular social platforms increased daily by almost 1 million new users. More than 3 billion people interact with social media every month, and 9 out of 10 use their mobile devices.
The main findings of the reports are discussed in detail below, but for now - here short review the most significant digital metrics in 2018:
- The number of Internet users in 2018 reached 4.021 billion people, which is 7% more compared to the same period last year.
- The audience of social networks in 2018 totals 3.196 billion people, which is plus 13% to last year's figure.
- 5.135 billion people use mobile phones in 2018 - 4% more than a year ago.
So what does all this valuable piece of information say?
1. Billion years
This year, not only the number of Internet users has increased. The time people spend online has also increased over the past 12 months.
According to the latest data from GlobalWebIndex, the average Internet user today spends about 6 hours a day using devices and services that depend on an Internet connection. This, roughly speaking, is a third of the total waking time.
If you multiply this time by 4 billion of all Internet users, then you get a staggering figure - in 2018 we will spend a total of 1 billion years online.

2. Distribution of the future
As noted in last year's report, internet access is unevenly distributed across the world. In 2018, the situation is almost the same, but there are some shifts.

While Internet penetration remains low in much of Central Africa and South Asia, these regions have seen the most impressive online growth rates.
Internet users in Africa are up 20 percent from last year's data. In Mali, the number of people with internet access has increased almost 6-fold since January 2017. Online audience in Benin, Sierra Leone, Niger and Mozambique for Last year doubled.
![]()
It's not just another billion connected.
The spread of the Internet in developing countries will change the way people use the Internet around the world. This is because companies like Google, Facebook, Alibaba and Tencent are committed to offering scalable global products that meet the needs of these new users and the environment in which they go online. These changes will definitely have a significant impact on the future of the Internet.
3. Communication in motion
More than two thirds of people around the world today own a mobile phone, most of them own smartphones.
Over the year, the number of unique mobile users increased by more than 4 percent, although penetration rates remain below 50 percent in much of Central Africa.

People all over the world prefer to go online from smartphones. They generate more web traffic than all other devices combined.

Moreover, this data only relates to web use. Today, people spend 7 times more time on mobile apps than on mobile browsers, according to recent data from mobile app market research firm App Annie. This suggests that the share of mobile devices on the Internet is most likely even higher than the above figure.
The latest information from Facebook only confirms this assumption: only 5% of the global audience of the social network use the platform exclusively from the desktop.

4. Eleven new users per second
Over the past year, a little less than one million people have discovered social networks for the first time every day - more than 11 new users per second.
The fastest growing among the 40 surveyed countries was Saudi Arabia- 32 percent. India lagged behind the leader slightly, the number of social media users increased by 31 percent over the year.

The growth was partly due to the fact that people of the older generation began to join social networks. On Facebook alone, the number of users aged 65 and over has increased by almost 20 percent in the past 12 months.
There are also more teenagers (13 to 17 years old) among the Facebook audience, but by only 5% since January 2017.

The gender ratio among Internet users remains uneven. For example, the latest data provided by Facebook suggests that there are still significantly fewer women online in much of Central Africa, the Middle East and South Asia.

5. The Philippines holds the lead
True, the Brazilians are already breathing down the back of their heads. The Indonesians and Thais have overtaken the Argentines to take third and fourth places in this year's rankings.

6. Facebook still dominates
For Mark Zuckerberg and his team, 2017 was another good year, with impressive growth across all platforms owned by Facebook Inc.
The main site of the Facebook group continues to dominate social media, growing its user base by 15% over the year. At the beginning of the year in social network there are almost 2.17 billion profiles.

WhatsApp and Facebook Messenger both grew at twice the rate of mainstream Facebook in the past year. During the year, the number of users in each of the applications increased by 30 percent.
Although the audiences of these apps are roughly equal, judging by the latest data from SimilarWeb, WhatsApp has come out ahead in geographic reach. Today, WhatsApp is the top messenger in 128 countries, while Facebook Messenger leads in 72.
In only 25 countries around the world, the most popular messaging app is not Facebook's messenger.

Despite these impressive stats, Instagram has managed to surpass all Facebook apps in terms of growth in the past 12 months. The number of users here has increased by a third.
7. Organic reach continues to fall
Facebook organic reach and engagement (based on data for 179 countries) declined over the past year, with average reach rates down more than 10 percent from the previous year. Despite the depressing momentum, these numbers will provide valuable benchmarks for marketers around the world.

8. Increasing the speed of mobile Internet
Data transfer rate in networks mobile communications growing, this trend can be traced on a global scale. Analyst agency GSMA Intelligence reports that over 60% of mobile connections today are broadband.

However, there are significant differences in the speed of mobile communication in different countries... In Norway, the average download speed for mobile networks is 60 Mbps - almost three times faster than the world average.
Users mobile internet 6 countries, including the Netherlands, Singapore and the UAE, boast an average connection speed of over 50 Mbps. At the other end of the ranking are 18 countries, including India and Indonesia, where the average data transfer rate on mobile networks does not exceed 10 Mbps.

The good news is that average mobile data rates have increased by 30 percent over the past year.
This news can please not only the impatient. A faster connection helps reduce stress levels. Studies have shown that a few seconds of delay in video loading can cause anxiety levels to jump, just like watching a horror movie or solving a complex math problem.
Thanks in part to faster data rates, the average smartphone owner, regardless of where they live, uses almost 3GB of data every month, up 50% from last year.

9. A sharp rise in spending in online stores
The total online commerce market in the consumer goods sector grew by 16% over the past year, according to the latest data from analytics agency Statista in its digital market survey. Annual spending reached $ 1.5 trillion in 2017, with fashion products being the largest single category.

Globally, the number of people using the platforms ecommerce for purchases of consumer goods (such as fashion, food, electronics, and toys) rose 8 percent. Nearly 1.8 billion people worldwide shop online today.
Approximately 45 percent of all Internet users make purchases on platforms e-commerce but the penetration rate of online commerce differs by country.

The receipt of each customer in the online trading segment is also growing. Compared to last year, the average revenue per user is up 7 percent to $ 833. The British spend most of all on online purchases - according to current data, in the UK more than $ 2,000 are spent per user annually.

It should be emphasized that these are figures only for consumer goods... If we add spending in other categories here, such as travel, digital content and mobile apps, the global e-commerce market is likely to be around US $ 2 trillion.
Internet in Russia 2018: the main figures
Russian digital market echoes global trends.

- Most popular mobile app in Russia (both by audience and by the number of downloads) - WhatsApp, followed by Viber, VK and Sberbank Online. Instagram ranks fifth in the ranking in terms of the number of users and sixth in terms of the number of downloads (here it was surpassed by the Yula service from Mail.RU Group).
- 63% of domestic Internet users search online for goods and services, but only 46% make purchases. The largest spending is on travel and hotels ($ 7.903 billion, up 24% from last year), toys and hobbies ($ 4.175 billion), and fashion and beauty products ($ 4.783 billion).
Top Internet Trends 2018
The digital market will continue to gain traction in 2018, and despite this year's unprecedented growth, we see an uneven distribution of access to the opportunities that the global network has to offer. This creates a good basis for development and suggests that the digital market has definitely not reached the ceiling yet.
Moreover, this development cannot be called linear. There is a transformation of online consumption: Internet users are becoming more mobile, desktops are being systematically replaced by more convenient devices that can be carried. As a result, purchases smoothly flow online, the web is losing ground, yielding part of the traffic to applications, and social networks play a more significant role - this is valuable information for business.
These are the main findings of the research conducted by We Are Social and Hootsuite. It is difficult to say for sure what awaits us in a year, but it is obvious that the Internet will become even more firmly part of our daily life changing the structure and methods of information consumption.
Many SMMs are very often interested in what time is the best to post in their group. Western colleagues have written a lot of articles about this, drew a bunch of infographics. But all this is about facebook, twitter, pinterest, and not about our VKontakte, in which we spend a lot of time.
In fact, this article will not talk about publishing posts to your group or public page, but about what time it is best to advertise in VK communities to attract users to a group or commercial sites (you sell something)
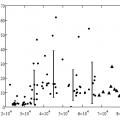
Probably it is worth starting with the fact that, like on television, there is prime time on the Internet - a period of time in which the maximum number of users is on the Internet. VK also has prime time. It looks something like this
- Activity - users online in the social network VKontakte
- Color - the redder, the more users online are in this period time
- Spaces- at some points in time it was not possible to receive data from VK
- Data - Russia, Moscow, different age groups (collected separately)
- Time- by MSC
From the picture "14-80" you can see that the general "prime time" starts at 20:00 every day of the week (slightly less on Friday and Saturday) and ends at 00:00.
Activity (the number of online users in VK) begins to grow from 8 am to 4 pm, where it hangs up to 20:00 and the growth continues after which, at about 01:00, it begins to fall rapidly until 04:00. From 04:00 to 07:00 on the social network the least number of people are from Moscow.
The general picture of activity is of little interest to anyone, so we will consider the activity of individual age groups.
We are interested in the age groups 22-30, 31-45 and 46-80 and the general group 22-80 ... with schoolchildren, children have not yet learned how to work, except in applications.
Based on the activity of different age groups, it is possible to build template models of user behavior. Approximately it looks like this
... woke up, had breakfast, checked through a smartphone, whether someone wrote on the social network during the night, the way to work, turned on the computer at work, looked in "My News", received the first stream of information for discussion with colleagues at lunch, worked until lunchtime , sometimes distracted by "My News" and a personal, had lunch, after lunch, to enter the working mode, I again checked the social network for new messages, and also quickly ran through the news feed, worked, before leaving work I checked the social network again, road home, came tired, washed, ate, at the same time turned on the radio or his playlist in social networks, continued to do household chores, sometimes distracted by answers in a personal, shared a couple funny pictures for relaxation and a sense of moral satisfaction, watched a TV series or movie on a social network, fell asleep ...
Of course, for a more accurate construction of the template, a survey of the group that will be targeted by advertising on the social network is necessary ( the target audience).
My personal experience the promotion of the meta-search engine of air tickets showed that users of the social network react to information about sales of air tickets (like, repost, follow links) better from 11 to 15.00, the peak of conversions from advertising fell on 11: 00-12: 00. At the same time, the placement of advertising in "prime time" did not give the same effect, despite the high activity of users of the social network.
From the heatmap, you can see that most ad bids in groups are placed from 13:00 to 16:00 on weekdays. Most advertisers have come to the correct conclusion - “prime time” VKontakte is not suitable for advertising, users want to relax and do household chores, and not receive information about tire sales in a group about cats.
In fact, based on the information above, you can draw conclusions about effective posting to your group or public page:
- Understand who your user (CA) is: at what time he is active on the social network, what he is doing, which communities he is subscribed to - create your own user behavior template to determine at what moment and what information he is ready to receive;
- Experiment and analyze. Track everything you can. Data will help build a pattern of behavior
General conclusion
Today is not yesterday, and tomorrow will not be today. Next Tuesday will only be a week away and it will be different because it will snow. At some point, someone will share the record, and there a friend with 100,000 subscribers will notice him and he will also share it, but tomorrow is not today, and this will not happen, which means last Tuesday was not as effective as compared to this, because no snow fell.
Any analytics system collects polygamy of site parameters, one of the most basic is the average visit time, but is it worth taking it literally? Let's take a look at Yandex.Metrica as an example.
Determination of this parameter in NM: “Time on site - the average time (in the format“ HH: MM: SS ”) spent on the site by visitors. It is calculated as the difference between the time of the last and the first registered view of the page by a visitor during one visit. "
The key word is “between”. Few people delve into the real meaning! This is not the average time a user spends on the site, but the time between (!) The first and last page viewed. The more pages a user views in one session, the closer this time is to the real one, but what if the site usually has 1-2 views per visit? Just forget about the existence of this statistic.
If you have a site where the user goes to landing page- is reading necessary information, calls on the phone, fills in an AJAX form, clicks-clicks, but does not overload the page (counter) and ... leaves, then the average stay time will be very far from the real one. Let me give you an example. Average time according to Yandex.Metrica data of users from search engines was 31 seconds.
Now we go to the Webvisor and see how things really were:

Those. the average residence time was actually 5 minutes 52 seconds. The reason for this difference is different approach collection of statistics.
The reason for this situation lies in the way of determining the duration of the user's visit. It is defined as the difference in time between loading the Metrica counter code on one page and loading the Metrica counter code on another page. Thus, if the user was only on one page, then we cannot accurately determine the time of visit in a regular report. The Webvisor's reports record the entire user's visit, therefore, in such records, the time of the visit is determined accurately.
Enabling the option to collect the “accurate bounce rate” in the counter settings will help to reduce the bounce rate - by excluding visits longer than 15 seconds and one hit, but not to increase the accuracy of the “watch time”.
Yandex.Metrica support service: When this parameter is set, an additional hit is sent after the first 15 seconds of stay. Further hits are not sent.
What to do?
If you need to fight for an increase in viewing time, then you need to motivate the user to walk around the site as much as possible, but if there is no such task, then just forget about this metric.
"Are you surfing the Internet again? How long can you? - I'm not for myself, I'm at work!" Perpetual dialogue, in which the percentage of truth usually tends to zero. To bring to clean water citizens who are overly keen on the network life to the detriment of direct job responsibilities or quiet family joys, sociologists of the Public Opinion Foundation (FOM) managed.
Judging by the data of their survey, Russians have finally moved into the category of Internet addicts. More than a third of Internet users (36%) admit that they spend too much time on the Internet (moreover for personal rather than work needs). Users living in rural areas complained about this more often (46%). More than half (52%) say that, they say, "we sit as long as necessary." And only 7% complain that they do not have enough time for the Internet.
For the purity of the experiment, the sociologists of the FOM conducted their research not using the online method, but in the usual way - they interviewed 1,500 respondents with questionnaires in their hands in one hundred settlements of 43 constituent entities of the Russian Federation. In the process, it turned out that half of Russians use the Internet, albeit with an uneven frequency: 37% - daily, the rest from once a month to several times a week. And among the respondents from the so-called daily Internet audience, almost a third of their acquaintances and friends, according to the respondents, clearly experience a serious dependence on the Internet. In the ranks of young users there are even more "network addicts" - 40%.
Among Russian Internet users, 38% use the World Wide Web several times a day not for work or study, but for their own needs and for the sake of interest. Approximately the same number - 37% make such a "spacewalk for personal need" at least once a day. One in five makes the Internet work for itself several times a week. The number of those who do this only once a week or a month is extremely small - 1-3%. And only two out of a hundred firmly said that they do not spend Internet traffic for personal needs. They apparently follow the logic of Kota Matroskin, only for new way: "I will not download anything, I will be economical." Including your own time.
More often than others, the so-called "people-XXI" (advanced, active, well-to-do and striving for various innovations in everyday life and at work) use the Internet for personal needs several times a day - in 43% of cases, as well as Muscovites (44% ), young people with higher education(46%). By the way, it is in vain to think that the Internet is "a toy for the rich." On the contrary: the highest number of people who use the Internet purely for themselves is among respondents with an income of less than 4 thousand per month and young people from 18 to 30 years old (49%).
For how long can a Russian hang out on the Internet on personal initiative and need? For a very long time. As a rule, on weekdays people spend online from half an hour to three hours (64%). Every tenth person sits on the Internet from 3 to 6 hours every day (a whole working day, only the work is free and purely "for oneself"!) There are also unknown heroes with red eyes and a back in the shape of an armchair. 4% spend 6 to 15 hours on the Internet. And the "sleepless patrol" closes the chain, which does not get out of the network for more than 15 hours every day, interrupting, apparently, only for short nightmares.
On weekends, internet addiction gives way to household chores and entertainment, but it still blooms in lush color. As many as 16% of Russians also stay on the screen and keyboard on weekends. Every fifth (21%) donates from half an hour to an hour of precious time to the Web, a third (35%) sits at a computer on weekends from 1 to 3 hours. And two and a hundred give this lesson over 15 hours, even on holidays and non-working days.
Moreover, Russians do not see anything particularly terrible in such a pastime: as already mentioned, only a third complain that the Internet is stealing too much of their time. Muscovites are the least concerned about this: in the capital, only every fifth (19%) is ready to admit that he suffers from Internet addiction. In cities with a population of one million, there are already a quarter of them (26%). They feel most acutely that "something is wrong with them", and the Internet should be less often, residents of cities with a population of 50 thousand to a million. 43% of the inhabitants of such settlements suffer from excessive Internet addiction. But the villagers feel worst of all, for whom the Internet cable sometimes becomes the only means of communication with outside world... 46% would like to spend less time online, but are unable to do so. Even for their own sake.
A third of Russian users are confident that abandoning the Internet would dramatically and significantly change their lives. 36% think that the changes, if access to the Internet were finally "cut off" for them, would not be too significant: they would have continued as they lived. A quarter of Russians said that giving up the Internet would not change their usual life in any way. By the way, our men are much more dependent on the Internet than women. Among the stronger sex, 38% in the absence of the Internet would have felt serious changes in the style and rhythm of life. Ladies gave this answer 10% less often. Young people under 30 would be very sensitive to such changes. The respondents of the older generation would hardly have felt the difference.
What we don't keep, when we lose, we cry. What would the Russians lose if their suddenly habitual and convenient access to the Internet disappeared - right, absolutely and completely? It would be sad then for our fellow citizens. 30% said that without the Internet, they would lose their most important source of information about literally everything - from traffic jams to international top news. 27% would be deprived of the opportunity to communicate with friends and acquaintances, especially those living in other cities. These are the worst possible losses. But the others are also not the most pleasant. 7% would find themselves without their usual entertainment and hobbies - films, music, and other types of leisure. The same number could not study and work without the Internet, write essays and get good grades for them. The worst would be for those who work part-time through the Internet in their free time. 3% would regret the wasted time, because everything would have to be done for a long time and "inoperative". A quarter of the surveyed users would not be able to pay their phone and other bills, or make purchases. Especially grieved were those who, without the Internet, would have been forced to "spend money on books" and not download them for free. "Pirate, forget about your home side" - I want to say to such users. But every twentieth is worth, apparently, wholeheartedly sorry. His or her life is so closed on the Web that without the Internet, "life would have lost its meaning," "it is the same as losing loved ones," and so on. It's scary to read: how did people live in the pre-Internet ice age?
But if all of a sudden the Internet in Russia disappeared overnight, many users would see such a "catastrophe" and pluses. There is a silver lining. 6% of Russians would immediately buy "a lot of free time" and find where to spend it effectively. Every twentieth would become more likely to communicate with real living friends, the same number would remember that they can read not only from the screen and, perhaps, would even purchase a subscription to the library, finally devote time to their own family and children.
Other positive results of the rejection of Internet binges, people called the fact that they could have new hobbies, time for sports, walking on fresh air and household chores. It is also important that one would be able to "preserve eyesight" and "sleep more": health on the Internet certainly cannot be bought or improved. Someone would immediately take the time to "tidy up the house", otherwise everything was overgrown with dust. But one in a hundred would persist in their dependence on consumer electronics. They will take away the computer and the Internet cable from him - he will sit down to the TV or at the game console, and will start chatting on the phone.
But addiction is addiction. A quarter of the surveyed users (24%) see only disadvantages in the rejection of the Internet and are sure that this way they would not gain anything good: “You cannot even imagine - a disaster. You would have to learn to live differently.”
Recently, I set out to find out at what time Vkontakte posts should be published in order to get maximum coverage. To find out, I did a little research.
It's about a group of copywriters. Other areas have their own audience with their own preferences and schedule.
Theoretical part
Interested subscribers so regularly visit the group to read new posts. It makes no sense to adapt to them. The more interesting you write, the more people will remember the community and view its wall.
But you can influence the number of people who see the post on the news. To do this, you just need to publish content when a lot of your subscribers are online. or just before rush hour. I also measured these indicators.
Experimenting
For experiments, I chose 3 communities: Overheard | Copywriting, My blog Web.txt and Copywriting Panda (the liveliest of the big bands). Purpose: to determine the time with the maximum online subscribers-copywriters.
The study lasted a week - from July 14 to 21. Every hour, starting at 9 am, Alexei and I checked online in these three groups, and entered the indicators into a table.
I made 7 simple tables in total
And then I calculated the average values, divided the results into groups: from the warmest (peak online) to the coldest.
Everything was counted according to Moscow time.
 The hour of the day is the busiest time
 People are still sleeping early in the morning - there is no point in publishing posts. The revival begins at noon, reaches a peak by 13-00 and remains at a high level for another 4 hours. After 17-00 working copywriters leave home - online falls. And at 21-22 o'clock people come in again.
What conclusions can be drawn from this:
- The best time to post is just before lunchtime peak. For example, at 12-30.
- The next post can be published right after lunch - online will be great for a few more hours.
- Publish evening posts around 20-30 - before the night peak.
Days of the week
I will also share the results by day of the week. This will be useful for those who do not post daily.
 It's always awful stagnation on weekends
 Of course, statistics based on one week's results are not very accurate. Therefore, I do not advise you to listen to her especially. Now I am working on automation of measurements. When everything is ready - I will collect readings in a couple of months - and then I will publish new, more accurate data.
But here the statistics of the Overheard group comes to my aid. There people offer content themselves, new posts appear regularly throughout the day. And we can look at activity statistics by day of the week.
 Activity graph in Overheard | copywriting for the last month
 Do you see the pits? It's the weekend. Don't post anything important over the weekend. Nobody will read it. The coolest content should be released on Monday-Tuesday. Then you will get maximum reach and the group will grow faster.
Social poll
I conducted a survey, which was attended by almost 200 people. The purpose of the survey is to find out at what time people prefer to view the news feed.
 Most often, the tape is flipped in the morning and in the evening.
 Conclusion: publishing evening posts (at about 20-00) is a great idea. Firstly, at this time in groups there is good online. Second, people are already free from work and ready to read your content. Thirdly, almost no one writes at night - so in the morning your posts will still be closer to the beginning of the news feed.
Of course, 200 people are very few. Don't take this survey too seriously.
conclusions
I will repeat myself. I've done research in groups of copywriters. It only applies to copywriters. If your target audience is not copywriters, don't use this data. They may not work for you. It's better to set aside a week and track your subscribers - it will immediately become clear to you when the content should come out.
What can be learned from the study:
- The best time to post is before lunch. This will give you maximum coverage in the news.
- The second place goes to the evening - 20-21 hours. At this time, good online, besides, your publications will still be visible in the morning.
- Don't post anything important over the weekend - your coverage will be minimal.
Thanks for taking the time to read this post. Hopefully my little research will help you increase your audience reach.